Found 271 results in 2 milliseconds.

Application

Glass Evaluation

Glass Evaluation Glass resistivity is key to PID susceptibility and must be tested independently from the solar cell and EVA Since the PV community recognized the PID issue, extensive research has shown that both the solar cell and its SiNx layer, as well as the encapsulation materials, significantly impact a module's PID susceptibility. In addition to the polymer foil, the glass also plays a critical role and needs to be evaluated. The PIDcon system allows for the assessment of glass influence on PID susceptibility. Using a sample stack that simulates a module, the user simply places the solar cell, EVA foil, and the glass to be tested. For accurate comparison, solar cells from the same batch and the same EVA foil should be used. Table 1 presents the ion analysis of various glass types tested via ICP. Table 1: Ion analysis of the investigated glass types by ICP Fig. 1: PIDcon measurement with the same type of solar cell and EVA foil and different glass types Fig. 2: dependency of the decrease in parallel resistance on the glas type [1] For more information please read: [1] V. Naumann, Ursachenanalyse und physikalische Modellbildung für potenzial-induzierte Degradation von Silizium-Solarzellen, Dissertation, Martin-Luther-Universität Halle-Wittenberg (2014) Matching Products PID series PIDcon bifacial Quality Control Solution for Bifacial PERC/PERC+, HIT, Topcon, c-Si Solar Cells, Mini Modules, and More Learn more Get in touch Do not hesitate to contact us – we are available to assist you with any inquiries or requests. Use our inquiry tool or reach out via email: sales @ freiberginstruments.com
Product

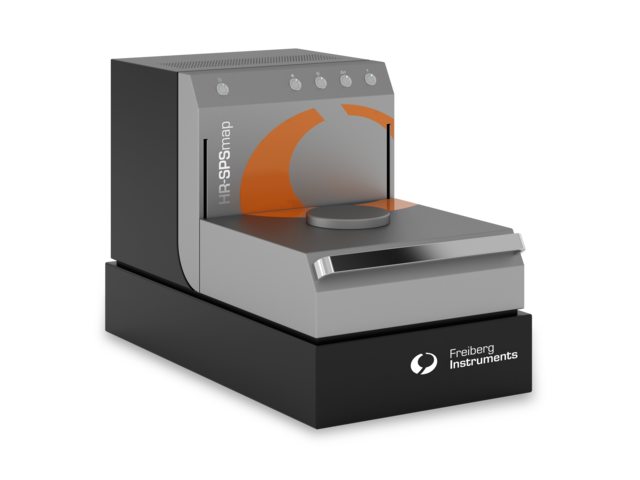
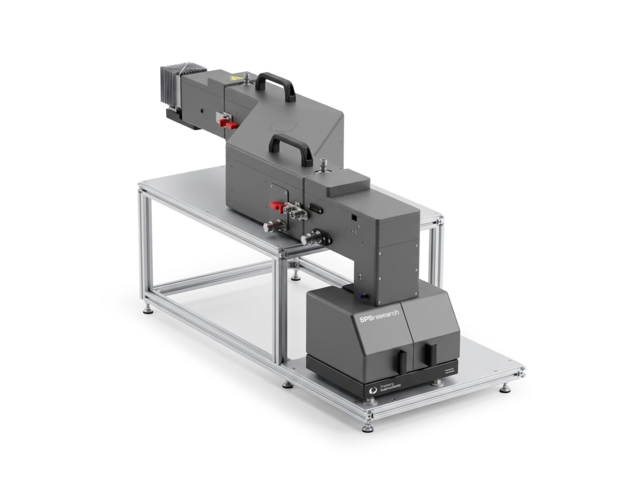
HR-SPSmap with fixed energy excitation sources

Skip breadcrumb navigation Breadcrumb Freiberg Instruments Products Surface Photovoltage Spectroscopy HR-SPSmap with fixed energy excitation sources HR-SPSmap High-Resolution and Sensitive Surface Photovoltage Measurement Solutions Interested? Get in touch! Contact now Product Sheet Skip menu Quick navigation Features Applications Specifications Technology Options Contact Enables advanced material research for thin layers and surfaces: destruction free, flexible and fast Highly sensitive due to an advanced electronic detection system Customized lasers and optics for up to 4 different wavelengths Investigation of charge separation processes and electronic transitions (defects) Materials Si SiC Ge GaAs Ga₂O₃ InP Diamond and more Features & Benefits 355–1550 nm Available wavelengths 10 ns Time resolution 0.1 mm Spatial resolution < 5 min Throughput for 8’’ wafer < 5 min Throughput for 8’’ wafer Sensitivity: sub-mV sensitivity and more than 3 orders of magnitude signal height resolution Measurement speed: < 5 minutes for a 150 mm wafer with 1 mm resolution Time resolution: 10 ns up to 100 ms Optical head: Up to 4 light sources integrated into the optical head or fixture for mounting of external lasers – build-in suppression of stray light Reliability: modular and compact bench top instrument for high reliability and uptime > 99% Flexible Mapping Tool for R&D and Production Monitoring The HR-SPSmap product platform builds on the proven foundation of the widely acclaimed MDPmap series. This compact, benchtop, contactless electrical characterization tool is specifically designed for offline production control and research and development applications. It measures surface photovoltage (SPV) across a wide injection range, accommodating both steady-state and short-pulse excitation. With automated sample recognition and parameter setup, it effortlessly adapts to a diverse range of samples, including epitaxial layers and wafers at various stages of processing, from as-grown material to fully fabricated devices. Exceptional Flexibility and Advanced Features One of the standout advantages of the HR-SPSmap is its exceptional flexibility. Equipped with fixed-energy excitation sources, the system supports the integration of up to four lasers within the measurement head. This capability facilitates injection-level-dependent SPV measurements across a broad range, from very low to high injection levels, and enables depth profiling using different laser wavelengths. The system also includes a bias light feature for enhanced measurement options. In addition, the HR-SPSmap supports custom calculations and mapping configurations, along with the ability to export primary data for detailed external analysis. For standard metrology tasks, the platform offers a predefined recipe system, allowing routine measurements to be completed with a single button press. Unlock Precision and Adaptability With its advanced capabilities and user-friendly design, the HR-SPS is the ideal solution for researchers and production teams seeking high-precision surface photovoltage measurements. Whether for R&D innovation or reliable production monitoring, this platform redefines flexibility and efficiency in electrical characterization. Applications Defects and charge dynamics in 3C- and 4H-SiC investigated by surface Photoelectrochemical (PEC) and photocatalytic (PC) water splitting for hydrogen and/or oxygen generation is leading the way not only to green hydrogen production, but also to oxygen generators… Learn more Defects in 4H-SiC Silicon carbide (SiC) high power, high voltage semiconductor devices lead the way not only for superfast chargers and on-board chargers for electrical vehicles (EV), but also power drive trains… Learn more Contactless characterization of SiC, GaN and AlGaN Aim SiC, GaN and AlGaN belong to the class of wide band gap semiconductors and are applied especially in power electronics, optoelectronic devices and transistors such as HEMTs (high electron… Learn more Study and monitoring of photocatalytic materials (TiO2) Aim Photocatalytic materials such as TiO2 are of great interest, for example, for cleaning of industrial wastewater and for water splitting. The identification of directed charge transfer is… Learn more Investigation of photocatalytic materials (BiVO4) Aim Photocatalytic materials such as BiVO4 are of great interest, for example, for water splitting. Electronic defect states and surface passivation are important limiting factors. Photocatalytic… Learn more Silicon photovoltaic – Wafer check after diamond wire sawing Diamond wire sawing (DWS) is an established technology for wafering semiconductor ingots, as it has many advantages over other technologies, such as of slurry cutting. Some of these advantages… Learn more Characterization of Ga2O3 Aim Ga2O3 is an ultra-wide band gap semiconductor with a great application potential. The contactless characterization of defect related transitions with high sensitivity is still… Learn more Electronic transitions in diamond Aim For further development of optoelectronic devices and other applications based on diamond and nanodiamond, contactless characterization of electronic defect states and electronic transitions… Learn more Contactless detection of bulk polarization phenomena in semiconductors [1] Levine, I. et al. "Bulk photovoltaic effect in carbon-doped gallium nitride revealed by anomalous surface photovoltage spectroscopy." Phys. Rev. B 101 (2020) 245205. Learn more Interested? Our experts are happy to assist you. Get in touch! Contact us now! Technical specifications sample size powder samples up to 300 mm diameter excitation select up to four different wavelengths from 337 nm up to 1550 nm (default 980 nm) material any photoactive material (contact us for consultation on your material) measureable time-resolved surface photovoltage measurements dimensions 680 x 380 x 450 mm, weight: app. 65 kg power 100 - 250V, 50/60 Hz, 5 A resolution 100 µm Technologies Electrical and optical characterization using surface photovoltage spe Photocarrier generation and separation mechanisms, Minority carrier lifetime measurement/Diffusion length calculations, Trapped carrier dynamics, time resolved, Surface Photovoltage… Learn more SPV signal analysis: fits and simulations We are currently developing simulation tools to enable first principle calculations of the electronic structure in a given photoactive material or material combination, based on solid-state… Learn more Comparison between MPD and SPV techniques MDP (microwave detected photoconductivity): sensitive to moving photogenerated charge carriers (bulk property), SPV (surface photovoltage): sensitive to surface AND bulk properties with respect… Learn more Static, transient or modulated light excitation pro and con The time-resolved or frequency-modulated, surface photovoltage spectroscopy (SPS) is based on a time-resolved/frequency modulated measurement of the spectral dependence of the surface… Learn more SPV-Picts SPV temperature dependence measurements Use this option to make SPV measurements at different temperatures between room temperature and 200°C. Temperature-dependent SPV measurements can be applied to measure activation energies or to… Learn more Materials Any photoactive material from raw material to finished device:From powder-based samples over wafers to boules or ingots. From 10 x 10 mm2 and up to 300 mm diameter, From titanium dioxide over… Learn more Accessories & Options Our devices offer versatile configuration options to meet specific requirements effectively. Each model can be customized to ensure maximum flexibility and efficiency. Contact for more information Wide range of laser light sources from 337 nm up to 1550 nm Integrated heating stage (20-250°C) Spot size variation Bias light Resistivity measurement (wafers) Reference wafer (Si) Get in touch Do not hesitate to contact us – we are available to assist you with any inquiries or requests. Use our inquiry tool or reach out via email: sales @ freiberginstruments.com
Product

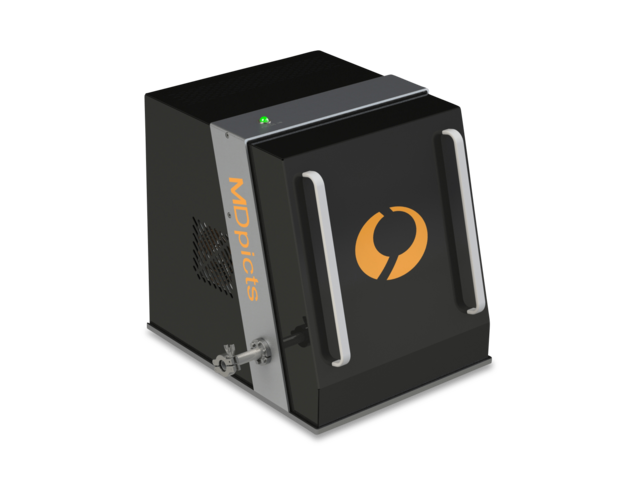
HR-SPSmap with variable energy excitation source

Skip breadcrumb navigation Breadcrumb Freiberg Instruments Products Surface Photovoltage Spectroscopy HR-SPSmap with variable energy excitation source HR-SPSmap with a variable energy excitation source Interested? Get in touch! Contact now Product Sheet Skip menu Quick navigation Features Applications Specifications Technology Options Contact Features & Benefits Sensitivity : μV sensitivity and more than 7 orders of magnitude signal height resolution Measurement speed : < 5 minutes per point for a 150 mm wafer with 1 mm resolution Time resolution : 10 ns up to 100 ms Optical head : laser driven light source with adjustable intensity and wavelength output between 200 and 3000 nm light. Spectral width < 10 nm. Reliability : Bench top instrument with build in monochromator for high reliability and uptime > 99% Customizable Mapping System for R&D Needs Flexible Mapping Tool for R&D The HR-SPSmap product with a variable energy excitation source is built on the same robust foundation as the fixed-excitation HR-SPSmap system. This compact, benchtop, contactless electrical characterization tool is designed for offline production control and research and development applications. It provides precise surface photovoltage (SPV) measurements across a wide injection range, supporting both steady-state and short-pulse excitation. Additionally, it offers continuous wavelength sweeps for true spectroscopy measurements, enabling reliable characterization of any photoactive sample. Versatile and Automated Adaptability The HR-SPSmap system is engineered for flexibility and efficiency. Automated sample recognition and parameter configuration allow seamless adaptation to a broad range of samples, including epitaxial layers and wafers processed at various stages, from raw material to fully finished devices. Whether for R&D innovation or stringent production monitoring, the HR-SPSmap with variable energy excitation delivers unmatched precision and versatility, setting a new standard in electrical characterization solutions. Applications Defects and charge dynamics in 3C- and 4H-SiC investigated by surface Photoelectrochemical (PEC) and photocatalytic (PC) water splitting for hydrogen and/or oxygen generation is leading the way not only to green hydrogen production, but also to oxygen generators… Learn more Defects in 4H-SiC Silicon carbide (SiC) high power, high voltage semiconductor devices lead the way not only for superfast chargers and on-board chargers for electrical vehicles (EV), but also power drive trains… Learn more Contactless characterization of SiC, GaN and AlGaN Aim SiC, GaN and AlGaN belong to the class of wide band gap semiconductors and are applied especially in power electronics, optoelectronic devices and transistors such as HEMTs (high electron… Learn more Study and monitoring of photocatalytic materials (TiO2) Aim Photocatalytic materials such as TiO2 are of great interest, for example, for cleaning of industrial wastewater and for water splitting. The identification of directed charge transfer is… Learn more Investigation of photocatalytic materials (BiVO4) Aim Photocatalytic materials such as BiVO4 are of great interest, for example, for water splitting. Electronic defect states and surface passivation are important limiting factors. Photocatalytic… Learn more Silicon photovoltaic – Wafer check after diamond wire sawing Diamond wire sawing (DWS) is an established technology for wafering semiconductor ingots, as it has many advantages over other technologies, such as of slurry cutting. Some of these advantages… Learn more Characterization of Ga2O3 Aim Ga2O3 is an ultra-wide band gap semiconductor with a great application potential. The contactless characterization of defect related transitions with high sensitivity is still… Learn more Electronic transitions in diamond Aim For further development of optoelectronic devices and other applications based on diamond and nanodiamond, contactless characterization of electronic defect states and electronic transitions… Learn more Contactless detection of bulk polarization phenomena in semiconductors [1] Levine, I. et al. "Bulk photovoltaic effect in carbon-doped gallium nitride revealed by anomalous surface photovoltage spectroscopy." Phys. Rev. B 101 (2020) 245205. Learn more Interested? Our experts are happy to assist you. Get in touch! Contact us now! Technical specifications sample size powder samples and up to 200 mm diameter excitation laser driven light source material any photoactive material (contact us for consultation on your material) measureable time-resolved and phase modulated surface photovoltage measurements dimensions 680 x 680 x 680 mm, weight: app. 100 kg power 100 - 250V, 50/60 Hz, 5 A Technologies Electrical and optical characterization using surface photovoltage spe Photocarrier generation and separation mechanisms, Minority carrier lifetime measurement/Diffusion length calculations, Trapped carrier dynamics, time resolved, Surface Photovoltage… Learn more SPV signal analysis: fits and simulations We are currently developing simulation tools to enable first principle calculations of the electronic structure in a given photoactive material or material combination, based on solid-state… Learn more Comparison between MPD and SPV techniques MDP (microwave detected photoconductivity): sensitive to moving photogenerated charge carriers (bulk property), SPV (surface photovoltage): sensitive to surface AND bulk properties with respect… Learn more Static, transient or modulated light excitation pro and con The time-resolved or frequency-modulated, surface photovoltage spectroscopy (SPS) is based on a time-resolved/frequency modulated measurement of the spectral dependence of the surface… Learn more SPV-Picts SPV temperature dependence measurements Use this option to make SPV measurements at different temperatures between room temperature and 200°C. Temperature-dependent SPV measurements can be applied to measure activation energies or to… Learn more Materials Any photoactive material from raw material to finished device:From powder-based samples over wafers to boules or ingots. From 10 x 10 mm2 and up to 300 mm diameter, From titanium dioxide over… Learn more Accessories & Options Our devices offer versatile configuration options to meet specific requirements effectively. Each model can be customized to ensure maximum flexibility and efficiency. Contact for more information Pulse width and height modulation Integrated heating stage (20–250 °C) Spot size variation Bias light Resistivity measurement (wafers) Reference wafer (Si) Get in touch Do not hesitate to contact us – we are available to assist you with any inquiries or requests. Use our inquiry tool or reach out via email: sales @ freiberginstruments.com
Product

HTpicts

Skip breadcrumb navigation Breadcrumb Freiberg Instruments Products Microwave Detected Photoconductivity HTpicts HTpicts Advanced High-Temperature Lifetime Measurement System for In-Depth Material Analysis Interested? Get in touch! Contact now Laser Selection Guide Skip menu Quick navigation Features Applications Contact Enables root cause analysis of deep material defects: destruction free, flexible and precise High temperatures for investigation of deep defect Customized laser and optic integration for all your materials Fully automated temperature dependent measurements Materials The HTpicts is specialized on deep defects in wide bandgap semiconductors SiC GaN AIN Ga₂O₃ Diamond and more Features & Benefits 355–1550 nm Available wavelengths 10 ns Time resolution 300–800 K Temperature range Extensive analysis Large software package Extensive analysis Large software package Applications Microwave Detected Photo Induced Current Transient Spectroscopy In order to investigate defects in semiconductors it is widely spread to use temperature dependent methods as deep level transient spectroscopy (DLTS). Usually for these methods it is necessary… Learn more Investigation of defect levels in InP MD-PICTS is a well suited method for the investigation of defect levels in InP. For example investigations on indium phosphide shows that the defect content changes during annealing processes,… Learn more Get in touch Do not hesitate to contact us – we are available to assist you with any inquiries or requests. Use our inquiry tool or reach out via email: sales @ freiberginstruments.com

Application

High precision Resistivity Measurement

High precision Resistivity Measurement on highly doped semiconductors Aim Measuring resistivity in highly doped semiconductors is crucial for several reasons: Quality control and Doping density verification Device performance prediction Extraction of material parameters as mobility and carrier concentration Process development (e.g. ion implantation) and simulation of doping models Detection of contaminations, process drift and inhomogeneities and defects as the growth facet in SiC for the Laser splitting process of SiC Hence precision and reproducibility are critical for advanced semiconductor applications. Solution The RESmap from Freiberg Instruments enables high-precision mapping of all kinds of highly doped materials (Si, SiC and more) in a range of 1 to 100 mΩcm with an unsurpassed repro-ducibility (σ < 0.15 %) due to the integrated distance and temperature sensors and the sensitive measurement head. This compact measurement head can also be used as a hand-held tool, it is available in a fully automated version with robot handling or can be integrated into the production line. Application example Figure 1 shows an exemplary mapping of the resistivity of a SiC raw wafer. The edge exclusion is appr. 5 mm. It is well known that the measured resistivity depends on the sample temperature, but also on the ambient temperature. Hence two T sensors are integrated in the measurement head. Figure 2 shows 1000 repeats of a resistivity measurement at a thick SiC boule (> 1 mm). The measurement head was driving in the home position after every measurement and the complete procedure took around 6 hours. In this time the ambient temperature changed and this test shows nicely how well the T com-pensation algorithm works. A reproducibility with s < 0.15 % is achieved with this T compensation algorithm. Figure 1: Example of a resistivity map of a SiC wafer For the cold laser splitting process for SiC also the crystal orientation is extremely important. Freiberg Instruments offers a lot of solutions for a fast and precise measurement of the crystal orientation, which can be tailored to your individual process line. Please check out our XRD solutions. Figure 2: 1000 repeats with movement to home position; with (σ < 0.15 %) and without temper-ature compensation (σ < 0.21 %) Figure 3: average of a 5 mm map of a 6’’ boule, measured 18 times on different days and differ-ent times, σ = 0.15 % Figure 4: dynamic temperature drift: sample was placed at a cold spot and measured during the warm up, the experiment took about 10 mins Matching Products RES series RESmap High-Precision Resistivity Mapping System for Accurate Material Analysis Learn more Get in touch Do not hesitate to contact us – we are available to assist you with any inquiries or requests. Use our inquiry tool or reach out via email: sales @ freiberginstruments.com

Application

Highly spatial resolved inline metrology on Multicrystalline Silicon

Highly spatial resolved inline metrology on Multicrystalline Silicon The minority carrier lifetime is a key parameter for the performance of solar cells. Therefore it is a suitable criterion for classifying wafers by means of quality. (Alttext zu lang) Non-destructive measurements of minority carrier lifetime are well established and widely used for process control and characterization of defects in crystalline silicon. With our tool MDPinline it is possible to map the minority carrier lifetime with a so far unsurpassed combination of spatial resolution, sensitivity and measurement speed. MDP inline tools enable whole wafer maps with a resolution of 2.8 mm up to (156 x 156 mm) in less than one second When it comes to the measurement of raw wafers it has to be taken into account, that not the actual bulk lifetime, but the effective lifetime, which consists of the surface and the bulk recombination, is measured. Therefore the measured lifetime of an as-grown wafer with a thickness of 200 μm is limited to approximately 2.3 μs. However if the bulk lifetime is very small, it will dominate the effective lifetime, so that a low quality can be recognized. Figure 1 displays the lifetime map of an as-grown multicrystalline wafer from the edge of a cast. The low quality edge, due to the contact with the crucible, can be easily distinguished from the better parts. Material classification The MDP inline tool is able to classify wafers in up to 15 quality classes. For that, different characteristic parameters are taken into account, like arithmetic average, harmonic average, average according to J. Isenberg, median and standard deviation. Note that a direct correlation between the effective lifetime and the efficiency of the solar cells is not present, because of the cell process which affects single regions in ingots differently. The software equipment developed for this tool also determines a variety of process relevant parameters and low quality edge areas of the wafers. The combination of lifetime averages and standard deviation enables a very good classification of the material quality. Figure 2 showcases an exemplary classification of three wafers from the bottom, middle and top part of an ingot. It is even possible to distinguish wafers of the bottom from those of the top part of the ingot. Wafer of the bottom often have higher oxygen and defect concentration, which results in a lower average lifetime. Wafers from the top often have a low lifetime, because of metallic impurities, a high nitrogen and carbon concentration and segregations of SiC, Si3N4 and other crystallization defects. Monitoring and recognition of crystal defects For the monitoring and recognition of crystal defects an extensive study was carried out, where specific wafers with special defect constellations were measured. In this study characteristic results for different crystallographic defects were determined. One of the most abundant defects are Si3N4 and SiC segregates, which lead to shunts in the solar cell. In the MDP lifetime maps these defects lead to a very high inhomogeneity and a high percentage of pixels with a lifetime under 0.2 μs. The second most abundant crystal defects are microcrystalline structures in the wafer. These structures lead to a very low lifetime, together with a low inhomogeneity. In combination with a crack tester these microcrystalline wafers can be recognized and distinguished from the wafers with segregates. Furnace monitoring Another useful application is the monitoring of furnace properties. Complications in the growth process can be detected and furnace properties can be optimized. Figure 4 and 5 show two examples of the above mentioned possible applications. In figure 4 the average of 5 ingots, which were grown in different furnaces, were plotted versus the ingot height. It becomes obvious, that different furnace properties lead to different slopes in the bottom and top part of the ingots. For example furnace 2 and 5 differ by about 30 % in the bottom slope and furnace 2 and 4 by about 50 % in the top slope. With this information an optimization of the furnace is possible. Figure 5 displays the abundance of a crystallographic parameter, which is characteristic for the material quality. A high value indicates a low quality and vice versa. The abundance of this parameter is displayed for the wafers of different weeks of production. Several thousand wafers were analyzed. Week 4 shows a higher percentage of wafers with a high crystallographic parameter. Apparently there have been contaminations in the feedstock or something influences the growth process, which can be detected with the MDP measurements. In such a way problems can be traced back to their origin and thus can be eliminated efficiently. Further applications especially for ingots are shown in other case studies. Inline mappings of as-grown wafers and ingots are a versatile tool for the detection of e.g. crystallization defects early in the production process. With the MDP tools MDPingot and MDPinline a full electrical wafer characterization at up to one wafer per second is possible. Along with the effective minority carrier lifetime also the resistivity is measured. With these investigations of each individual wafer, a huge variety of applications are possible like process control, yield and process improvement as well as a fast ramping up of any new production line or process. In inline applications, this opens an entire spectrum of new possibilities towards a highly efficient optimization of products and production processes together with an improvement of yield. For more information read: [1] K.Dornich, N.Schüler, D. Mittelstrass, A. Krause, B. Gründig-Wendrock, K.Niemietz, J.R. Niklas, Conferenceproceedings 24th PVSEC Hamburg (2009) in press Lifetime map of a mc-Si wafer from the edge of a cast ingot Exemplary classification of three wafers of bottom (a), the middle (b) and top(c) of an ingot. Si3N4 and SiC segregates (a); microcrystalline wafer (b) average versus ingot height for 5 ingots grown in different furnaces | histogram of the crystallographic parameter of different weeks Related Solutions and Industries: Epitaxial Layers & Thin Films Matching Products MDP series MDPlinescan Versatile OEM Unit for Lifetime Measurements on Silicon Samples, from Bricks to Processed Wafers Learn more MDP series MDPspot Quick and Simple Lifetime Measurement Made Easy Learn more MDP series MDPmap Precision Lifetime Charachterization with Exceptional Sensitivity Learn more MDP series MDPpro Advanced Lifetime Measurement System for Quality Control and Material R&D on Semiconductors Learn more Get in touch Do not hesitate to contact us – we are available to assist you with any inquiries or requests. Use our inquiry tool or reach out via email: sales @ freiberginstruments.com

Page

Imprint/Disclaimer

Imprint/Disclaimer Freiberg Instruments GmbH Delfter Str. 6 09599 Freiberg Saxony, Germany Contact Mr. Ing. Thanga Kumar +49 3731 419 54 0 sales @ freiberginstruments.com Authorized representative, responsible for the shown content Dr. rer. nat. Kay Dornich Registered office: Freiberg/Sachsen Commercial register: AG Chemnitz HRB 22507 VAT registration number: DE246095095 Disclaimer Liability for content As a service provider, we are responsible for our own content on these pages in accordance with Section 7 (1) TMG (German Telemedia Act) and general legislation. According to §§ 8 to 10 TMG, however, we as a service provider are not obliged to monitor transmitted or stored third-party information or to investigate circumstances that indicate illegal activity. Obligations to remove or block the use of information in accordance with general legislation remain unaffected by this. However, liability in this respect is only possible from the time of knowledge of a specific infringement. As soon as we become aware of such infringements, we will remove this content immediately. Liability for links Our website contains links to external third-party websites over whose content we have no influence. Therefore, we cannot accept any liability for this third-party content. The respective provider or operator of the pages is always responsible for the content of the linked pages. The linked pages were checked for possible legal violations at the time of linking. Illegal content was not recognizable at the time of linking. However, permanent monitoring of the content of the linked pages is not reasonable without concrete evidence of an infringement. If we become aware of any legal infringements, we will remove such links immediately. Copyright The content and works created by the site operators on these pages are subject to German copyright law. Duplication, processing, distribution and any form of commercialization of such material beyond the scope of the copyright law shall require the prior written consent of its respective author or creator. Downloads and copies of this site are only permitted for private, non-commercial use. Insofar as the content on this site was not created by the operator, the copyrights of third parties are respected. In particular, third-party content is identified as such. Should you nevertheless become aware of a copyright infringement, please inform us accordingly. If we become aware of any legal infringements, we will remove such content immediately. References: Disclaimer from eRecht24

Page

InfraRedPhotoLuminescence (IRPL)

Skip breadcrumb navigation Breadcrumb Freiberg Instruments Products Luminescence Dating and Dosimetry lexsygresearch Configuration options InfraRedPhotoLuminescence (IRPL) InfraRedPhotoLuminescence (IRPL) allows very precise measurements due to the non-destructive nature of the measurement Interested? Get in touch! Contact now Compared to the standard IRSL the IRPL signal from K-feldspar is considered as probably being not, but certainly much less affected by fading (Prasad et. al., 2017). It also exhibits a larger dose range, thus allowing the dating of old samples. The required pulsed stimulation and detection of both emissions (880 and 955 nm) is implemented into l exsyg TL/OSL reader , which allows very precise measurements due to the non-destructive nature of the measurement. However, not all samples appear to show a 955 nm emssion and detection at 880 nm might be sufficient. Prasad, A. K., Poolton, N. R. J., Kook, M., and Jain, M. (2017). Optical dating in a new light: A direct, non-destructive probe of trapped electrons. Scientific Reports 7, 12097, 10.1038/s41598-017-10174-8.

Application

Infrared stimulated Luminescence dating of feldspar (IRSL)

Infrared stimulated Luminescence dating Many types of sediment do not contain quartz and for dating the light exposure to light of such sediments Infrared stimulated Luminescence (IRSL) is used. Due to higher saturation doses the age range is larger than for OSL Internal dose rates in K-feldspar reduce dependency on external dose rate and water content Might suffer from an anomalous signal loss which leads to age underestimation Post-Infrared Infrared luminescence (p-IRIR) allows the dating of Middle Pleistocene sediments Preusser, F., Muru, M., and Rosentau, A. (2014). Comparing different post-IR IRSL approaches for the dating of Holocene coastal foredunes from Ruhnu Island, Estonia. Geochronometria 41, 342-351. Zöller, L., Richter, D., Masuth, S., Wunner, L., Fischer, M., and Antl-Weiser, W. (2013). Luminescence chronology of the Grub-Kranawetberg site, Austria. Eiszeitalter & Gegenwart / Quaternary Science Journal 62, 127–135. IRSL-signals of a single aliquot from a SAR protocol applied to polymineral loess Related Solutions and Industries: Luminescence Dating and Dosimetry Matching Products TL/OSL series lexsygsmart The most sensitive TL/OSL reader Learn more TL/OSL series lexsygresearch The most advanced TL/OSL reader Learn more Get in touch Do not hesitate to contact us – we are available to assist you with any inquiries or requests. Use our inquiry tool or reach out via email: sales @ freiberginstruments.com

Product

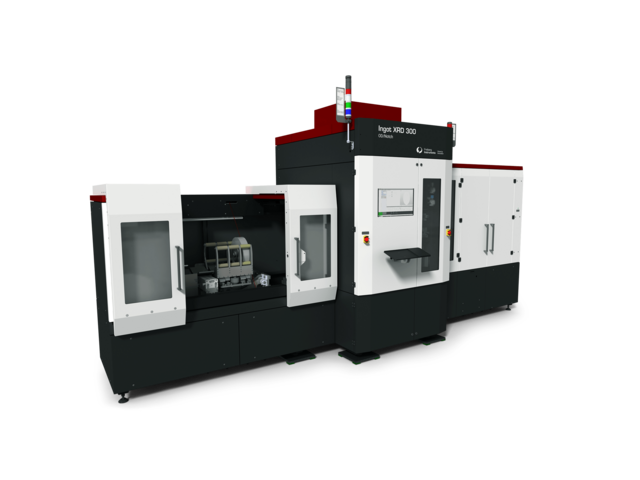
Ingot XRD

Skip breadcrumb navigation Breadcrumb Freiberg Instruments Products X-ray Diffraction Ingot XRD Ingot XRD OD/Notch Enables existing equipment to reach high-end OD/Notch specs for 200 mm and 300 mm ingots Interested? Get in touch! Contact now Product Sheet Skip menu Quick navigation Features Specifications Technology Software Contact Rethink your ingot grinding preparation: automated, precise, fast. Rapid determination of crystal orientation Optical geometry inspection with integrated confocal sensor Accurate and fully automated gluing and end piece attachment Features & Benefits 70–300 mm Ingot size 0.005° On-axis precision Flexible Loading and communication options Cylinder Calculation with hybrid metrology Cylinder Calculation with hybrid metrology Highest precision with high-speed measurement: < 5 secs/sample Typical standard deviation tilt (example: Si 100): < 0.003 °, minimum < 0.001 ° Automatic ingot alignment Automatic positioning of glue pieces Optical determination of geometric features (flat/notch position) of raw and/or grinded ingots Automatic marking of ingots Easy integration into process line (manual or robotic loading) Data Matrix Code (DMC) reader MES interface; SECS/GEM or similar up to 300 mm diamter and up to 520 mm lenght ingots Revolutionize your ingot grinding preparation with Ingot XRD 300 OD/Notch Discover the Key Advantages in 60 Seconds Ingot XRD 200 for 200 mm Ingots Ingot XRD 300 for 300 mm Ingots Interested? Our experts are happy to assist you. Get in touch! Contact us now! Specifications Parameter Standard deviation Diameter < 6 µm (grinded ingots); < 30 µm (raw ingots) Notch/Flat postion < 0.01° Notch depth < 6 µm Notch opening angle < 1.5° X-ray axis Vs. Flat/Notch position < 0.02° Ingot length > 0.1 mm Technologies Omega-scan Ultra-Fast Orientation Measurement for Single Crystals Learn more Software XRDStudio Multiple Operating ModesOperator Mode: Designed for fixed measurement parameters, ensuring a safe and streamlined workflow. Administrator Mode: Allows for the creation and modification of… Learn more Get in touch Do not hesitate to contact us – we are available to assist you with any inquiries or requests. Use our inquiry tool or reach out via email: sales @ freiberginstruments.com